WAN Capacity Planning
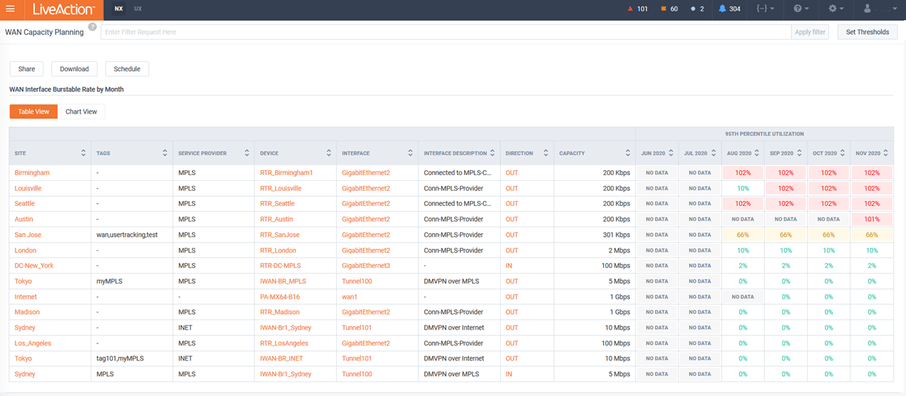
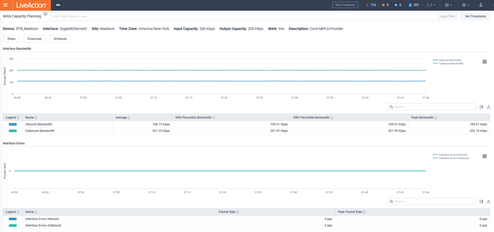
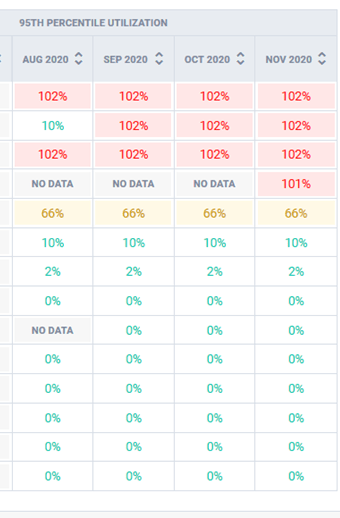
The WAN Capacity Planning story will monitor each WAN interface’s monthly utilization for the previous six months. This data is based on SNMP utilization.
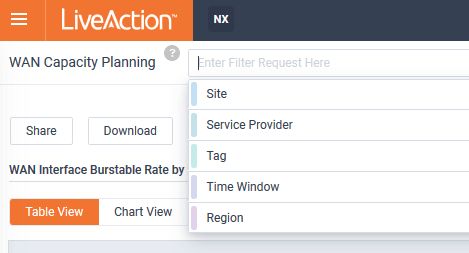
The reported interfaces can be Filtered to focus the scope of the Story.
Clicking the details of the story will pivot to a curated historic report template for the WAN interface during the month selected.
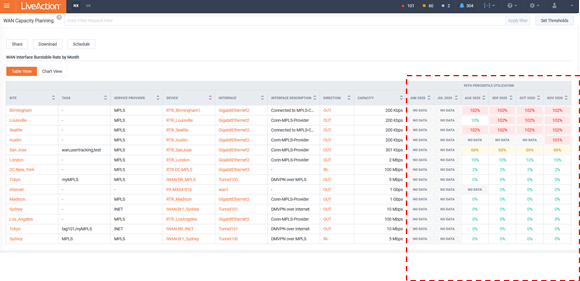
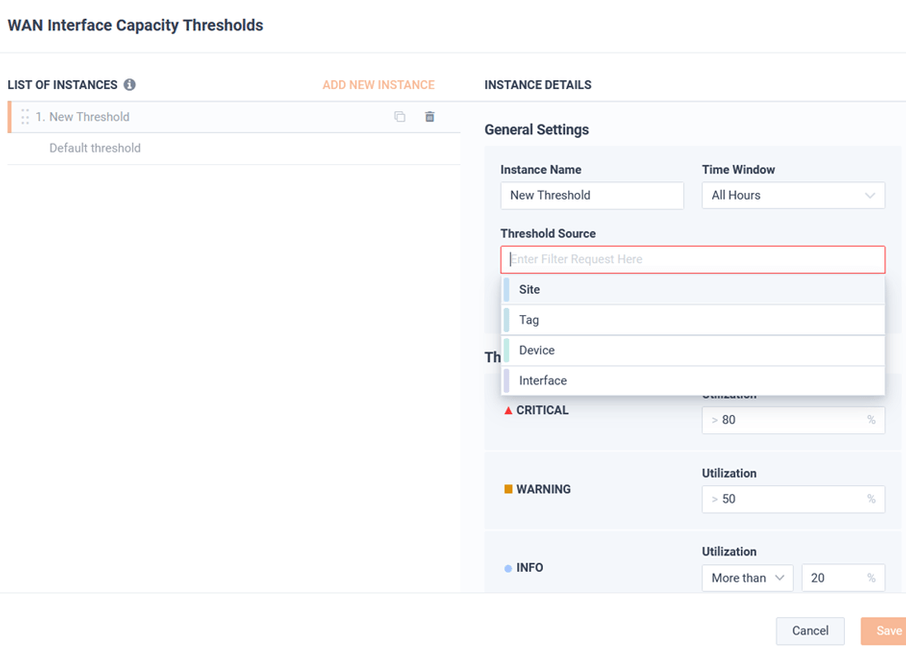
To manage the color coding of the table in the story, select Set Thresholds.
Multi-instance Filters can be used to set the thresholds colors used by the story.
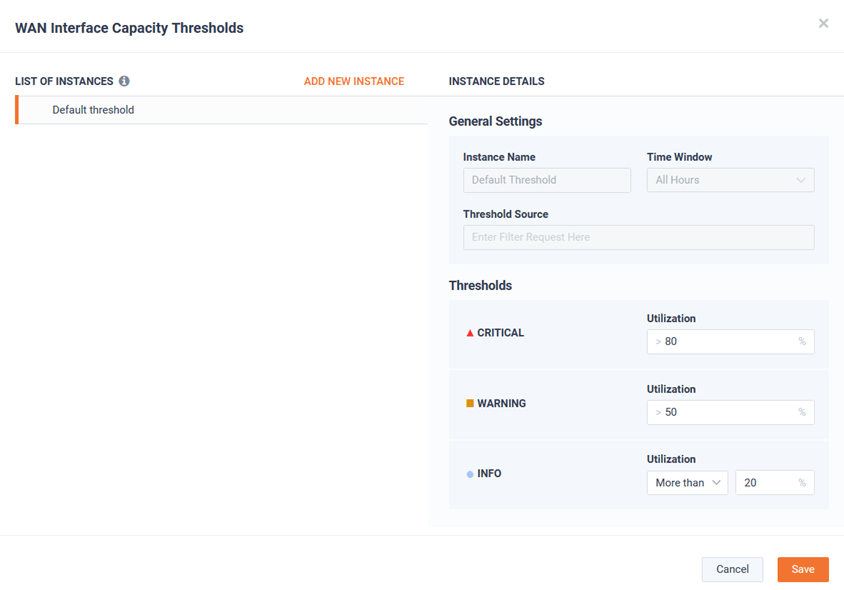
Filters and Time Window can be used for instance to further refine these thresholds.