System Diagnostics
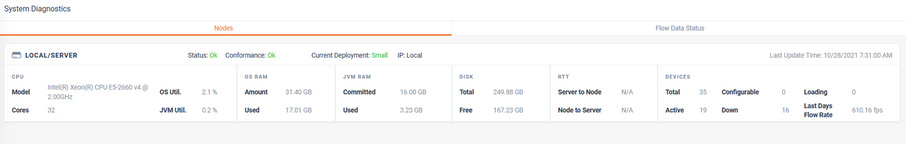
System Diagnostics will present the LiveNX Server’s and any associated Node collector’s health. It also provides visibility into System, Node, and device Flow rates.
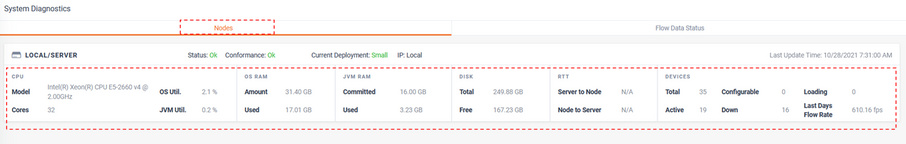
From the Nodes tab, by clicking on the summary bar, you can drill-down to more details.
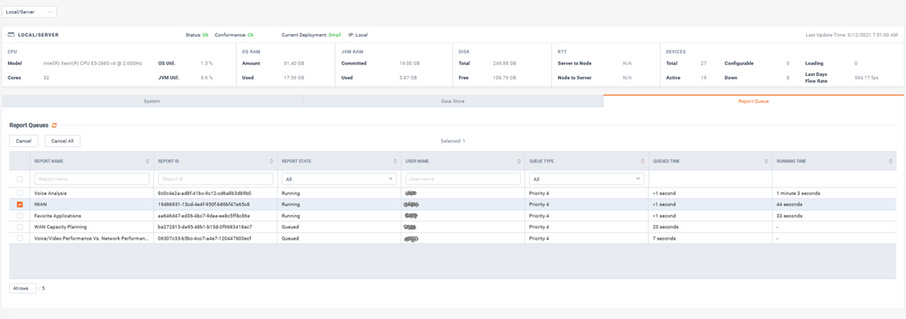
When drilling-down into a specific Server/Node appliance, more details are available on three tabs:
• System
• Data Store
• Report Queue
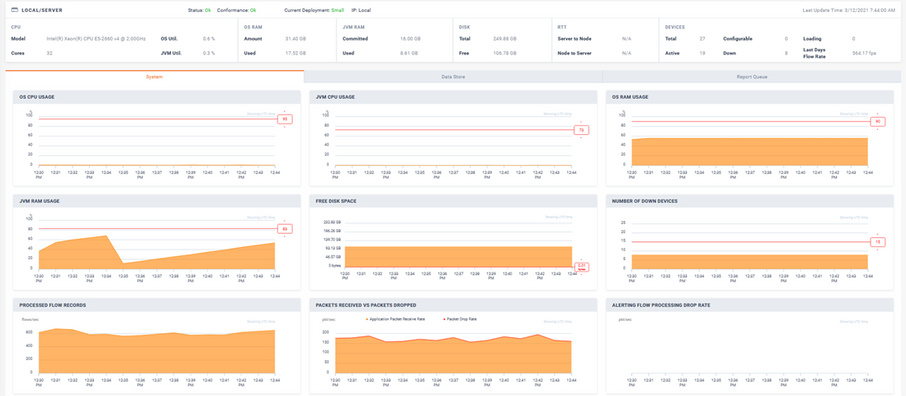
The System tab provides the recent history of the appliance’s performance statistics.
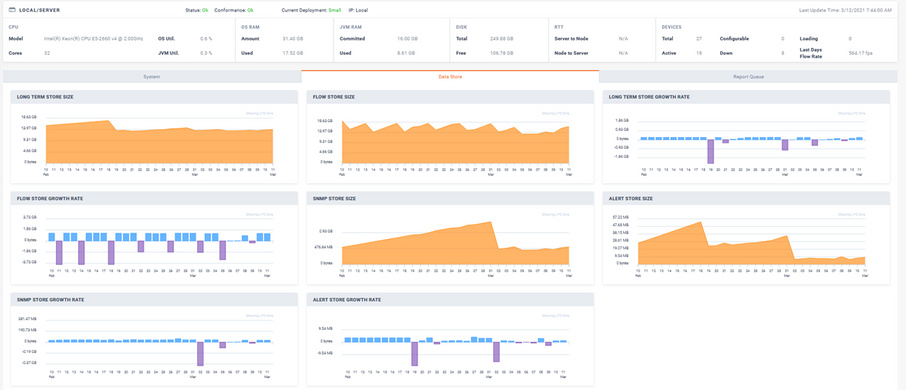
The Data Store tabs breaks down the last 30 day’s utilization of appliance’s the disk usage.
The Report Queue will list any reports that are being processed or a waiting in queue for processing.
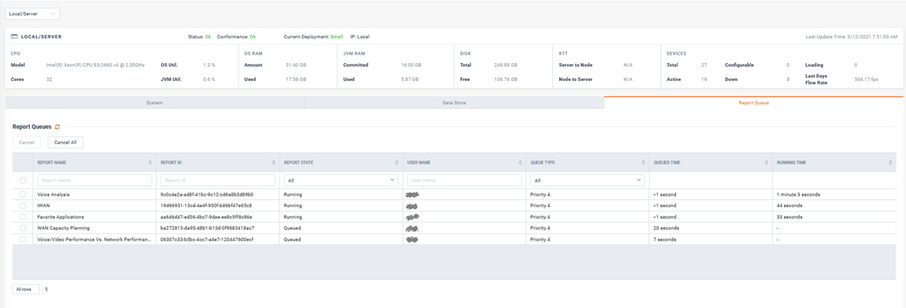
To cancel a report from running, select the report and click .
To cancel all reports, click .