Dashboard
Client mode / Dashboard / Edition || Multi-tenant mode / Template / Dashboard
Building a dashboard is basically a question of configuring the “context bar” and inserting the dashlets. The “context bar” filters the dashboard scope on specific network nodes (area, site, application, etc.) and enables to zoom in on a period of time. Each dashlet will be updated according to this scope.
Create a dashboard by clicking:
• “New” or
 in the dashboard library in client mode.
in the dashboard library in client mode.• “Create dashboard” in the template menu in multi-tenant mode.
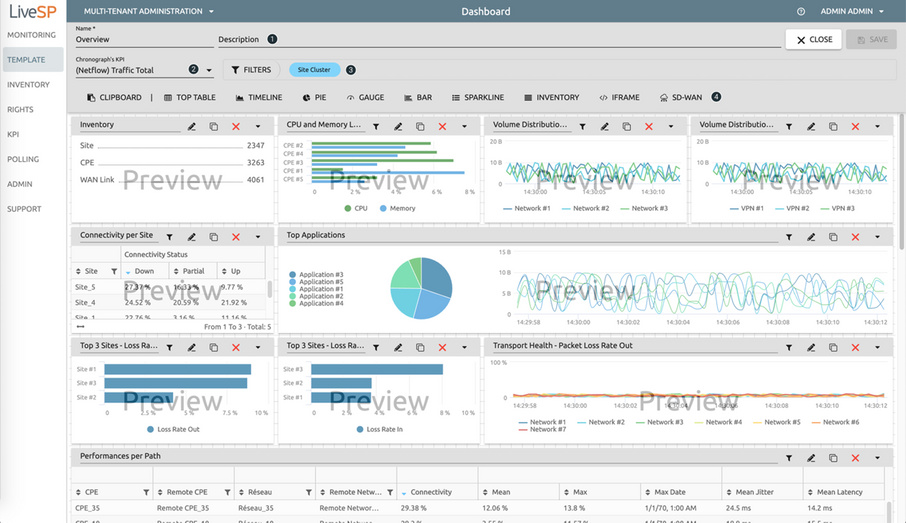
1. Name and describe the dashboard, to help end-users understand the purpose of the dashboard.
2. Choose an optional sparkline KPI used to browse the time period.
3. Choose the network filters which will be used to control the dashboard (see below).
4. Insert a new dashlet or a dashlet from the clipboard.
It is possible to limit or fix the selection of elements that the user can select in the context bar. For example, you might want to be able to select only networks that are named “MPLS” or sites that have “Cisco” CPEs.
Contextualize a dashboard by clicking “Filters.”
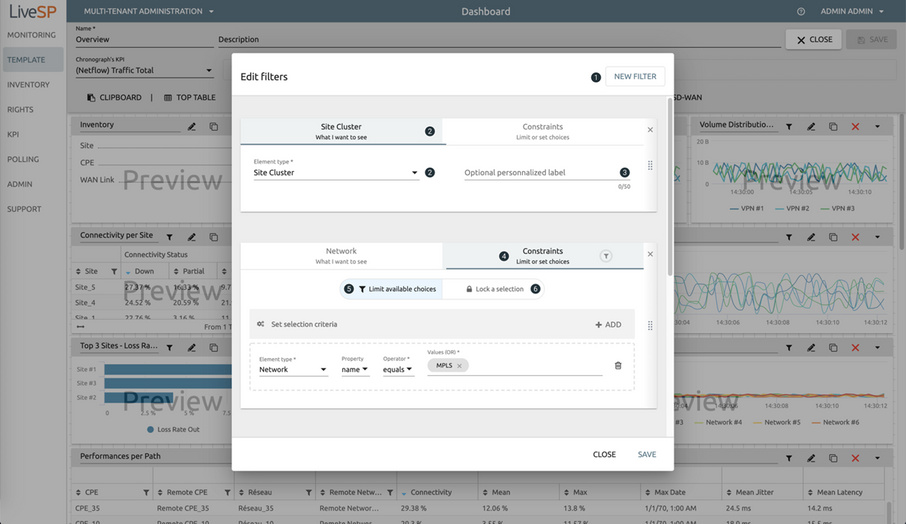
1. Add a new network element.
2. Choose the network element.
3. Override its label.
4. Constraint the selection of elements.
5. Limit to elements following some criteria.
6. Force the selection of pre-selected list of elements.