Table
Table can be used to display more details and KPIs in a single view. Start by choosing the network elements. Select the KPIs that need to be displayed. And finally define the table layout: merge cells and customizable.
Create a table dashlet by clicking
 in the edition tool bar.
in the edition tool bar.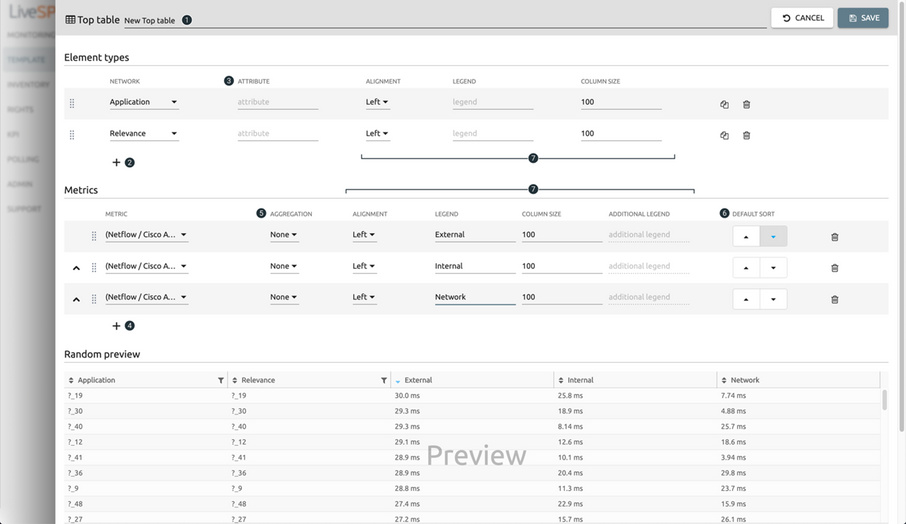
1. Name your dashlet.
2. Select network elements.
3. Display an attribute of the network element.
4. Select KPIs from the KPI library.
5. Override the aggregation of the KPI.
6. Sort the data set.
7. Sketch the style of the different lines and name columns.