Drill down
Client mode / Dashboard
When you detect unusual spikes of traffic or high end-to-end latency for a specific application, you might need more details to understand the issue. The drill down feature will help you deep-dive, step-by-step by displaying the relevant dashboards. When you need more details on a site, DSCP, device or application, click on the magnifying glass beside the legend. LiveSP will automatically propose the relevant dashboards.
Access more details by clicking
 on a dashlet legend.
on a dashlet legend.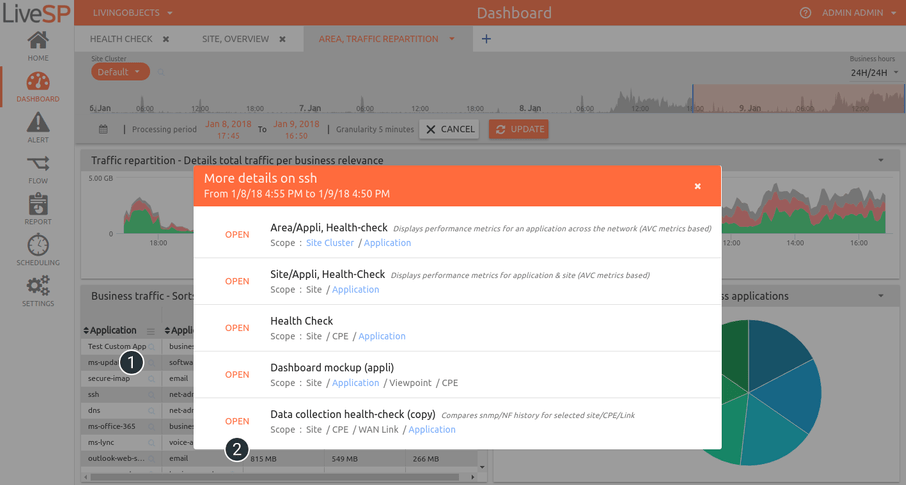
1. Click on the selected element you want to drill down on (site, device, application, etc.).
2. Choose the new dashboard to open to display more details.