Applications dashboard
The Applications dashboard displays key applications statistics for the capture. This application visibility provides insight into user behavior and traffic patterns on the network at certain times of day, week, month, or year. It helps the analysts to better understand who is going to what web sites and using which applications when.
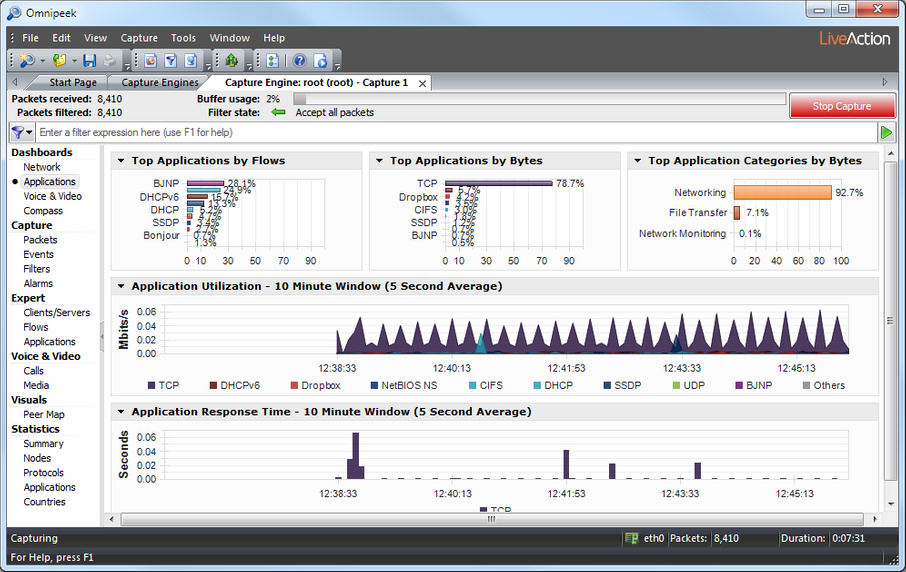
• Top Applications by Flows: This display shows a graph of top applications by flow count. Clicking any application in this display lets you drill-down to that application in the Expert Applications view. You can right-click inside the display to select a Bar, Column, Pie or Donut display; select Auto Scale or Fixed Scale; or to select an Automatic, Light, Dark, or Clean background theme for the display.
• Top Applications by Bytes: This display shows a graph of top applications by bytes. You can right-click inside the display to toggle the display with the Top Protocols by Bytes display; select a Bar, Column, Pie or Donut display; select Auto Scale or Fixed Scale; or to select an Automatic, Light, Dark, or Clean background theme for the display. Mouse over a bar (or slice) of the graph to view a tooltip with additional details for the application. Clicking a bar (or slice) of the graph opens a Detail Statistics window populated with details for the application clicked.
• Top Protocols by Bytes: This display shows a graph of top protocols by bytes. You can right-click inside the display to toggle the display with the Top Applications by Bytes display; select a Bar, Column, Pie or Donut display; select Auto Scale or Fixed Scale; or select an Automatic, Light, Dark, or Clean background theme for the display. Mouse over a bar (or slice) of the graph to view a tooltip with additional details for the protocol. Clicking a bar (or slice) of the graph opens a Detail Statistics window populated with details for the protocol clicked.
• Top Application Categories by Bytes: This display shows a graph of top application categories by bytes. You can right-click inside the display to select a Bar, Column, Pie or Donut display; select Auto Scale or Fixed Scale; or to select an Automatic, Light, Dark, or Clean background theme for the display. Mouse over a bar (or slice) of the graph to view a tooltip with additional details for the application categories.
• Application Utilization: This display shows the top applications by bits per second. You can right-click inside the display to select a Stacked Column, Skyline, Stacked Skyline, Area, Stacked Area, Line, or Line/Points display; select whether the display is Linear or Logarithmic; show Min/Max values; or select an Automatic, Light, Dark, or Clean background theme for the display. You can select an area of the graph, right-click and choose Select Packets. Only packets available in the capture buffer will be accessible for Select Packets.
• Application Response Time: This display shows response time of the top applications by largest response time. You can right-click inside the display to select a Skyline, Area, Line, Line/Points or Points display; select whether the display is Linear or Logarithmic; show Min/Max values; or select an Automatic, Light, Dark, or Clean background theme for the display. You can select an area of the graph, right-click and choose Select Packets. Only packets available in the capture buffer will be accessible for Select Packets.
TIP: Several of the displays inside the Applications dashboard support tooltips. Hover over the display to view a tooltip with additional information.
You can also access additional options for viewing each display by clicking the small arrow in the upper left corner of each display, or by right-clicking inside each display.
You can also access additional options for viewing each display by clicking the small arrow in the upper left corner of each display, or by right-clicking inside each display.