Voice & Video dashboard
The Voice & Video dashboard provides a visual display of voice and video call summary information, as well as useful graphs and statistics to troubleshoot and analyze voice and video traffic.
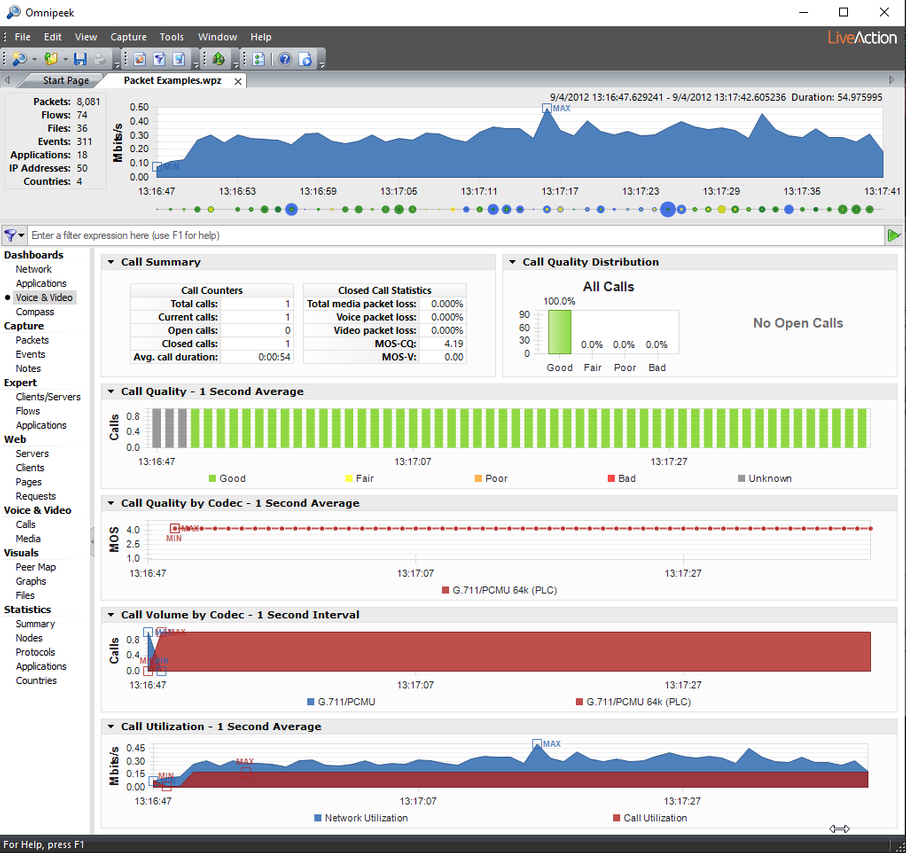
The parts of the Voice & Video dashboard are described below.
• Call Summary: This display shows “Call Counter” information and “Closed Call Statistics” on voice and video packet loss. In addition, the Call Summary displays the Max Call Time which is the point and time when the maximum call limit was reached. The Max Call Time is displayed in red text and will dynamically appear. You can right-click inside the display to select an Automatic, Light, Dark, or Clean background theme for the display.
NOTE: Max Call Time only appears when the max call limit has been reached. See Summary voice and video statistics.
• Call Quality Distribution: This display shows open and closed calls by quality based on MOS scores. You can right-click inside the display to select a Bar, Column, Pie, or Donut display; or select an Automatic, Light, Dark, or Clean background theme for the display.
MOS scores are calculated for each media flow independently, and each call’s quality is the lowest MOS score of any of its associated media flows. Voice media is scored with MOS-CQ and video media with MOS-V.
The quality thresholds are as follows:
• <2.6 = Bad (displayed in Red)
• >=2.6 to <3.1 = Poor (displayed in Orange)
• >=3.1 to <3.6 = Fair (displayed in Yellow)
• >=3.6 = Good (displayed in Green)
Media flows with unsupported codecs are not included in the display since we cannot obtain MOS values for these calls. Additionally, the display reflects that same data present in the Calls and Media views, and therefore is affected by the 2000 call limit.
• Call Quality: This display shows call quality over time for calls classified as good, fair, poor, bad, and unknown. You can right-click inside the display to select a Stacked Column, Skyline, Stacked Skyline, Area, Stacked Area, Line, Line/Points, or Points display; show Min/Max values; or select an Automatic, Light, Dark, or Clean background theme for the display. You can also select an area of the Call Quality graph, right-click and choose Select Packets.
• Call Quality by Codec: This display shows a line graph of the quality for each codec in use over time. You can right-click inside the display to select a Line, Line/Points, or Points display; show Min/Max values; or select an Automatic, Light, Dark, or Clean background theme for the display. You can also select an area of the Call Quality graph, right-click and choose Select Packets.
MOS scores are used for the quality measurement. Voice media shall be scored with MOS-CQ and video media with MOS-V.
The quality for a time period shall be the average of the MOS scores for all open media flows for that time period. In addition, this graph will only display MOS scores for supported codecs as unsupported codecs do not provide MOS measurements.
• Call Volume by Codec: This display shows a graph of open calls (per codec) over time for voice and video calls. This graph reflects all calls from the Calls and Media view, and unlike the other graphs in the dashboard, the graph includes data for calls using unsupported codecs. You can right-click inside the display to select a Stacked Column, Skyline, Stacked Skyline, Area, Stacked Area, Line, Line/Points, or Points display; show Min/Max values; or select an Automatic, Light, Dark, or Clean background theme for the display. You can also select an area of the Call Volume graph, right-click and choose Select Packets.
• Call Utilization: This display shows a graph of overall network utilization compared to network utilization by VoIP protocols. You can right-click inside the display to select a Skyline, Area, Line, or Line/Points display; select whether the display is Linear or Logarithmic; show Min/Max values; or select an Automatic, Light, Dark, or Clean background theme for the display. You can also select an area of the Call Utilization graph, right-click and choose Select Packets.
This graph displays two legends: Network Utilization and Call Utilization. Utilization values are displayed in Mbits/second. The VoIP utilization shall be the total utilization for all VoIP packets (i.e., signaling, media RTP/RTCP, and unsupported codecs).
TIP: Several of the displays inside the Voice & Video dashboard support tooltips. Hover over the display to view a tooltip with additional information.
You can also access additional options for viewing each display by clicking the small arrow in the upper left corner of each display, or by right-clicking inside each display.
You can also access additional options for viewing each display by clicking the small arrow in the upper left corner of each display, or by right-clicking inside each display.