Capture Engine graphs capture options
The Graphs options of the Capture Engine Capture Options dialog lets you manage the graphing capabilities for individual Capture Engine captures.
The parts of the Graphs options of the Capture Engine Capture Options dialog are identified below.
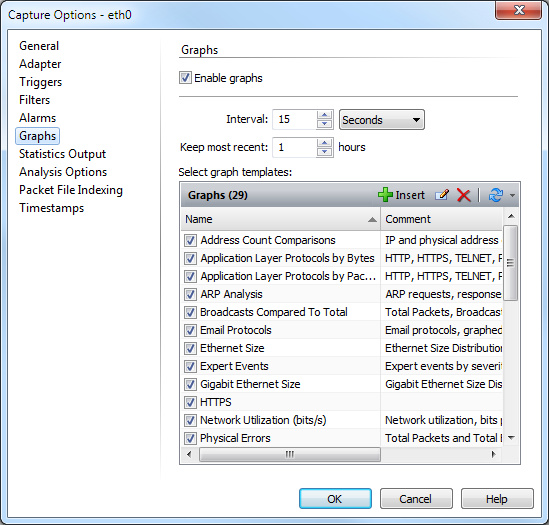
• Enable Graphs: Select this check box in order to have the Graphs view appear in the Capture Engine capture window.
• Interval: Choose the sampling interval for all statistics used for graph creation in the current Capture Engine capture window. Enter a value and choose the units.
For any statistics item normally expressed per unit of time, the graphing function creates an average value over the sampling interval you choose.
• Keep most recent…hours: Choose number of hours for statistics collection.
Files are created on the hour. One folder per capture is created, with one *.sts file per hour of preserved graph data. There is an added *.sts file for the data from the current hour. For example, if your Keep most recent setting is eight hours, then there will be nine *.sts files.
• Select Graph Templates: This section shows all currently defined graph templates and provides tools for creating and managing them. (See Capture Engine graphs tab for details on creating graph templates.)
Select one or more graph template(s) to add them to the Graphs view of the new Capture Engine capture window.