Graph display options
The Graph Display Options dialog lets you control how a graph is displayed. The dialog has up to five tabs, depending on the statistical context and whether it is a free-standing window or it is displayed in the Graphs view of a capture window or file.
To open the Graph Display Options dialog in Omnipeek:
• Click in the toolbar of a Graphs window. The Graph Display Options dialog appears.
To open the Graph Display Options dialog in Capture Engine:
1. Right-click in the graphs area of a Capture Engine capture window.
2. Choose …. The Graph Display Options dialog appears.
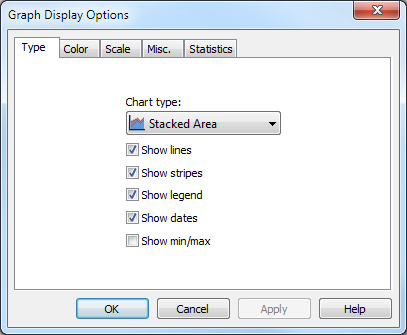
• Type: This tab lets you choose the type graph to display. The choice of graph types is context sensitive, and only those choices applicable to the graph being modified are available.
• Color: This tab lets you control the color of display elements. Click in the color swatches to choose from the palette.
• Scale: This tab controls the scale used for the Y-axis (vertical scale) of the graph.
• Misc.: This tab allows you to configure additional settings for your graph.
• Statistics: This tab presents a list of each statistics item displayed in the current graph. The drop-down list at the bottom of the tab presents alternative choices for the Units used to measure the selected statistics item.
NOTE: Click on the dialog to learn more about the available options and settings.
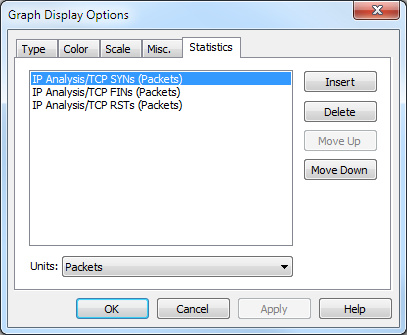
To add or delete items from the Statistics tab:
1. Click or a insert or delete a statistics item. Click or to move the selected item up or down in the display.
2. Click to open the Add Statistic dialog.
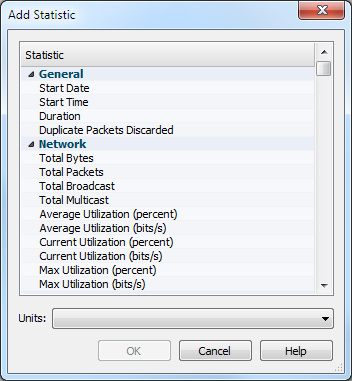
The Add Statistic dialog presents a scrollable hierarchical list of all statistics in the Summary view and a drop-down list for choosing the appropriate Units of display for the highlighted statistics item.
3. Click to return to the Graphs Display Options dialog.