Protocols statistics
Protocols statistics show network traffic volume in packets and in bytes, broken down by protocol and subprotocol. You can view protocol statistics in a hierarchical or flat view.
To view Protocol statistics:
• Click the Protocols view in the navigation pane of a capture window.
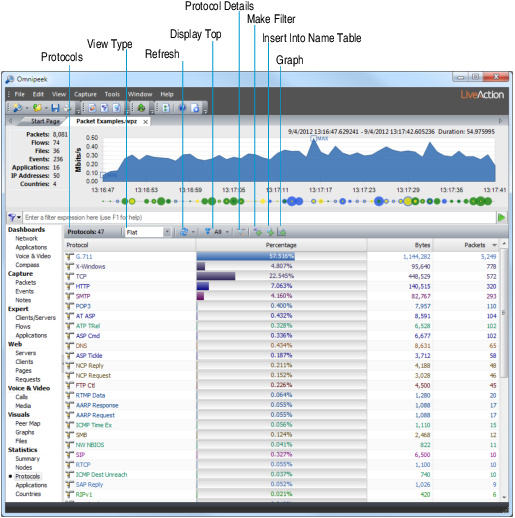
The parts of the Protocols view are described below.
• Protocols: Shows total count of protocols seen.
• View Type: Choose a Hierarchy or Flat type of display.
• Refresh: Sets display refresh interval. If interval is set to Manual, display will update only when is clicked.
• Display Top: Limits display to top 5, 10, 20, 50, or 100 protocols seen, as measured by traffic volume.
• Protocol Details: Opens Detail Statistics window.
• Insert Into Name Table: Adds the selected protocol to the Name Table.
TIP: For a description of a particular protocol or subprotocol, right-click the protocol in any window where it is shown, and choose .