Monitor
The Monitor view displays the health of the overall system. The view is broken up into four usage charts and one interface statistics table.
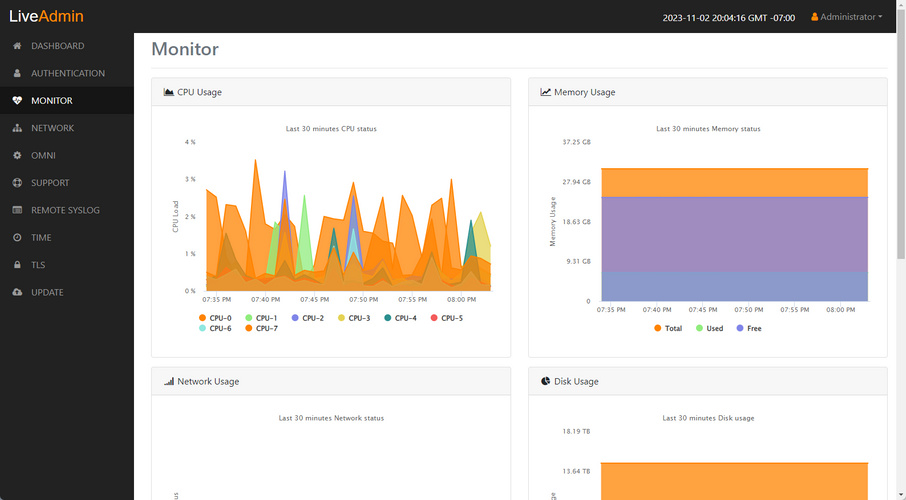
◦ CPU Usage: This chart displays the current usage of individual CPUs on the system. Click the CPU label in the legend to enable/disable its data displayed in the chart.
◦ Memory Usage: This chart displays the current amount of memory being consumed on the system. Click the Total, Used, or Free labels in the legend to enable/disable which data to display in the chart.
◦ Network Usage: This chart displays the current throughput of the network interfaces. Click the labels in the legend to enable/disable which data to display in the chart.
◦ Disk Usage: This chart displays the current amount of space being used by the Data and Metadata volumes. Click the Total, Used, or Free labels in the legend to enable/disable which data to display in the chart.
◦ Interface Statistics: This table displays the statistics of the primary management interface. To update the statistics click .