Timeline dashboard
The Timeline dashboard is available from Capture Engine capture windows that have any of the Timeline Stats options enabled in the Capture Options dialog. The dashboard displays top talkers, top protocols, and network utilization for the Capture Engine.
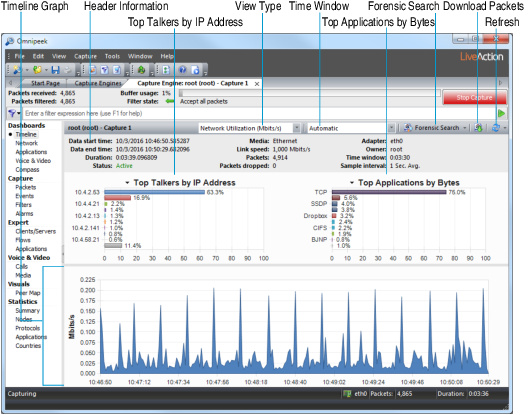
The parts of the Timeline dashboard are described below.
• Header Information: The header information displays statistics for the capture session (data start time, data end time, duration, status, packets, packets dropped, adapter, etc.).
• Top Talkers by IP Address: This display shows a graph of top “talkers” on the network for the selected area in the Timeline graph, broken out by node. You can right-click inside the display to display top talkers by Physical Address, IP Address, or IPv6 Address; or to select a Bar or Pie display. Mouse over a bar (or slice) of the graph to view a tooltip with additional details for the node.
• Top Applications by Bytes: This display shows a graph of top applications on the network for the selected area in the Timeline graph. You can right-click inside the display to toggle the display with the Top Protocols display, or to select a Bar or Pie display. Mouse over a bar (or slice) of the graph to view a tooltip with additional details for the application.
• Top Protocols by Bytes: This display shows a graph of top protocols on the network for the selected area in the TimeLine graph. You can right-click inside the display to toggle the display with the Top Applications display, or to select a Bar or Pie display. Mouse over a bar (or slice) of the graph to view a tooltip with additional details for the protocol.
• Timeline graph: The Timeline graph displays the data of the selected capture session. Only one capture session at a time can be displayed inside the graph. By default, the graph shows network utilization in Mbits/s, but other statistics can be graphed as well by selecting the View type.
Here are descriptions of other parts of the Timeline graph:
• Right-click inside the graph to perform a forensic search (see Forensic search from the ‘Forensics Capture’ window), download selected packets to a capture file, refresh the window, or choose a different graph format: Bar, Stacked Bar, Skyline, Area, Stacked Area, Line, Line/Points, Linear, and Logarithmic. Additionally, you can also toggle displaying the minimum and maximum points for each series on the graph.
• Mouse over a data point in the graph to view a tooltip displaying timestamp and size information (e.g., time and rate, time and packet size, etc.).
• Any time there is more data than can be displayed on the screen, a scroll bar appears below the graph and allows you to view different points of time in the graph. (If the Time window is set to Automatic, the scroll bar will never appear.)
• If the Time window is set to anything other than Automatic, a scroll bar appears below the graph and allows you to view different points of time in the graph.
• View type: Select the type of statistics to display in the Timeline graph. You can select from:
• Network Utilization (Mbits/s)
• Network Utilization (Packets/s)
• Unicast/Multicast/Broadcast
• Packets sizes
• VLAN/MPLS
• Protocols (Mbits/s)
• Protocols (Packets/s)
• Applications (Mbits/s)
• Applications (Packets/s)
• Call Quality
• Call vs. Network Utilization
• Wireless Packets (Packets/s) (Capture Engine for Omnipeek (Windows) only)
• Wireless Retries (Packets/s) (Capture Engine for Omnipeek (Windows) only)
NOTE: To display statistics for either the Call Quality or Call vs. Network Utilization view type, the VoIP Stats option must be selected when you first create the capture and configure the General options of the Capture Options dialog. See Configuring general options.
• Time window: Select the time interval to display in the Timeline graph. By default, Automatic is selected to display the optimum window based on the available data. Intervals from 5 Minutes (1 Sec. Avg.) to 24 Hours (5 Min. Avg.) are also available.
• Forensic search: Click to display the Forensic Search dialog where you can adjust the forensic search settings. Click the small down arrow next to Forensic Search to display custom or pre-configured settings for performing a forensic search. You can change any option prior to clicking :
• Custom: Creates a Forensic Search window based on the customized settings that you configure.
• Overview: Creates a Forensic Search window based on settings that display an overview of the selected data in the capture session.
• Packets: Creates a Forensic Search window containing a packets-only view.
• Expert: Creates a Forensic Search window based on settings that are optimized for Expert analysis.
• Voice & Video: Creates a Forensic Search window based on settings that are optimized for Voice & Video analysis.
• Download Packets: Click to download the packets from the selected capture session, in the selected time range.
• Refresh: Click to refresh the screen. For an active capture session, you can also set an automatic refresh interval by selecting an interval from the drop-down list to the right of the button.