Compass dashboard
The Compass dashboard is an interactive forensics dashboard that displays network utilization over time including event, protocol, flow, node, channel, WLAN, VLAN, data rate, application, and country statistics. These statistics are displayed in selectable Data Source widgets which can be viewed from a real-time capture or from a single supported capture file.
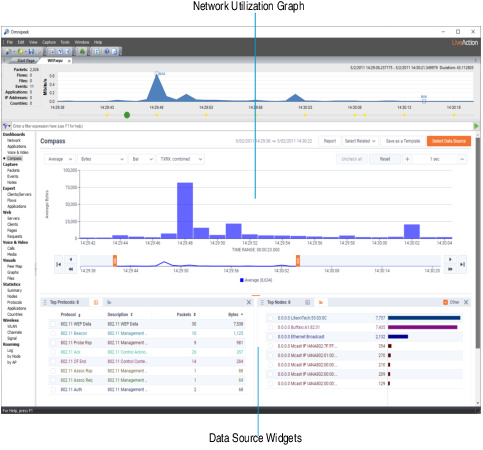
The parts of the Compass dashboard are described below.
• Network Utilization Graph: Displays two interactive timeline graphs that allow you to select and display a range of data. See Network utilization graph.
• Data Source Widgets: Displays enabled statistics widgets (events, protocols, flows, nodes, channels, WLAN, VLAN, data rates, applications, and countries). See Network utilization graph and Data Source widgets.
TIP: You can use the orange horizontal splitter located between the network utilization graph and the Data Source widgets to resize the displays.