Data Source widgets
The Data Source widgets display statistics for Expert Events, protocols, flows, nodes, channels, WLAN, VLAN, data rates, applications, and countries. Each widget displays statistics appropriate to the selected data source and for the selected time range in the network utilization graph. You can display these widgets in a list view or bar chart.
The list view and bar chart are always in sync. Enabling an item in one of the widget will be reflected in all of the other widgets. Using a Protocols Data Source widget as an example, the parts of a Data Source widgets are described below.
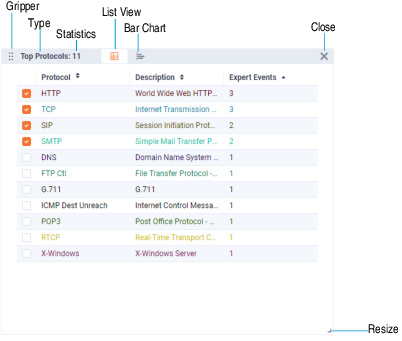
• Gripper: Allows you to drag the widget to a different location within the dashboard.
• Type: Displays the type of Data Source widget.
• Statistics: Displays the number of statistics over the selected time range within the top limit count.
• List View: Displays statistics in a list view.
• Bar Chart: Displays statistics in a bar chart.
• Resize: Drag to resize the Data Source widget.
• Close: Click to disable the widget from the dashboard.
List view
In the list view, the columns appropriate for the statistic and unit selected are displayed. By default, only the top 50 items are listed. This limit can be adjusted through the Compass options dialog.
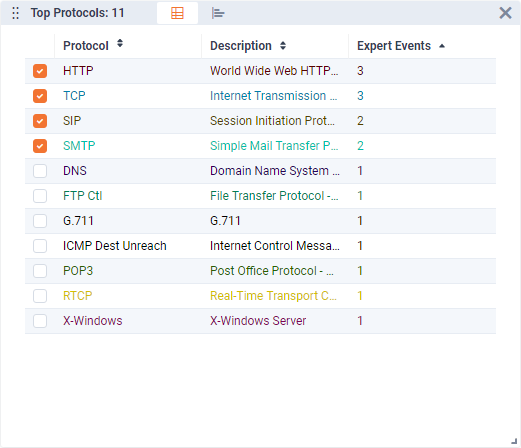
In the list view, you can:
• Click a column header to sort in ascending or descending order.
• Use the check boxes to enable or disable graphing of a specific statistics in the network utilization graph. Enabling a check box in the list view enables the same statistics in the top statistics bar chart.
Bar chart
The statistics bar chart displays the top 10 statistics, with all other statistics grouped as ‘Others.’
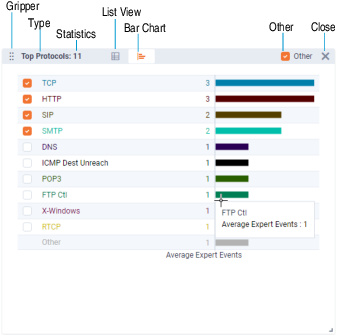
In the bar chart, you can:
• Click a check box in the bar chart to toggle the display of statistics in the network utilization graph. Additionally, clicking a check box (except for Others) selects the check box of the same statistic in the list view.
• Mouse over a bar to see details about a specific statistic.
• Select or clear the ‘Others’ check box to show or hide ‘Others’ from the bar chart.