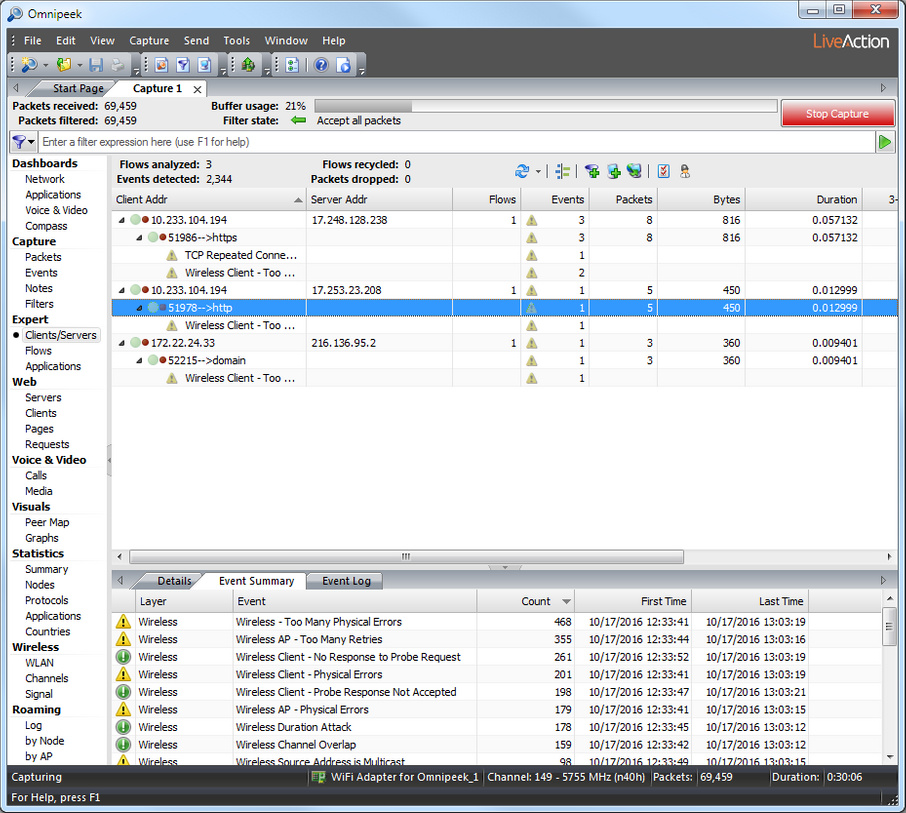
Expert Clients/Servers view
The Expert Clients/Servers view makes it easy to track events and to see them in the context of peer-to-peer or client-server traffic patterns.
To display the Clients/Servers view:
Select Clients/Servers under Expert in the navigation bar of a capture window. The hierarchy of information in this view is displayed as follows:
• Pairs of nodes (addresses)
• Individual flows between these addresses
• Individual events under specific flows.
TIP: Right-click in the upper pane and choose to display the hierarchical levels
The Expert Clients/Servers view shows green or white traffic indicator lights showing activity for the related nodes:
• A green light indicates that the node is “active” (a packet has been received in the last few seconds).
• A light green light indicates that the node is “inactive” (a packet has not been received in the last few seconds).
Smaller LED lights appear to the right of the traffic indicators when an event has been detected:
• A red LED indicates one or more events whose severity is Major or Severe.
• A yellow LED indicates one or more events whose severity is Informational or Minor.
TIP: Place the cursor over these indicators to show a data tip with details of recent activity and the severity of the events detected.
The Events column of the Expert Clients/Servers view shows an icon for the most severe event detected.
For a complete list and description of the columns available in the Clients/Servers view, see Expert clients/servers, flows, and application view columns.