Omnipeek capture window graphs
The Graphs view allows great flexibility in the display of statistics. You can add to, delete, rearrange, create, edit, export, and import graphs of a wide range of formats, each based on single or multiple statistics from the current capture window.
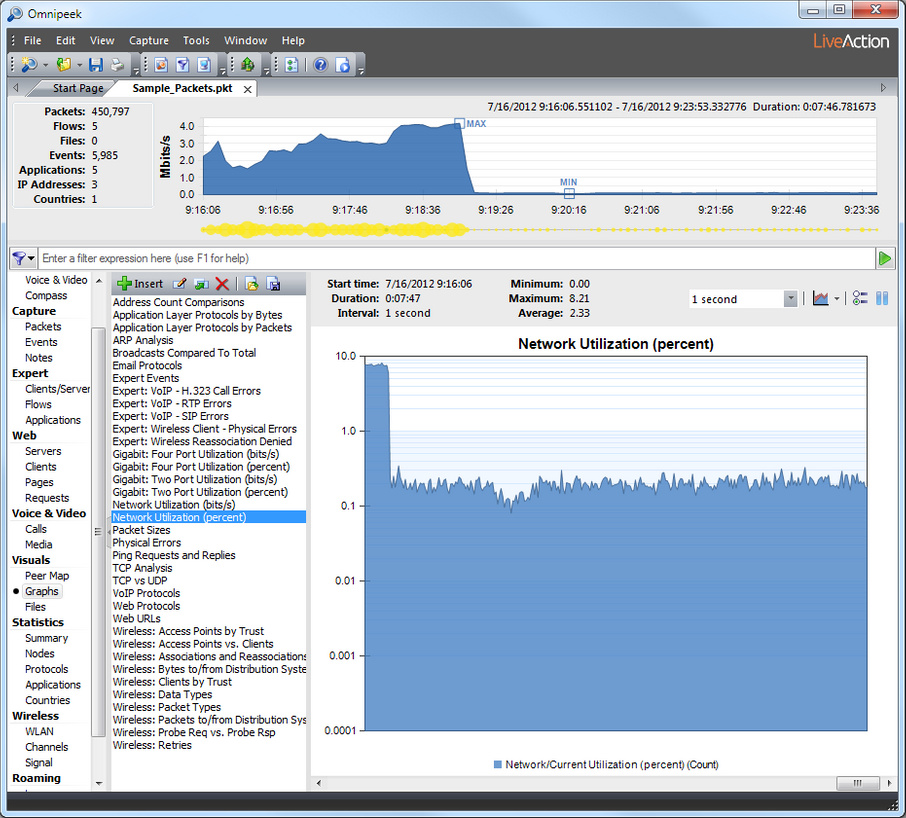
Select any title from the list to display that graph in the right pane.
The parts of the Omnipeek Graphs view are identified below.
• Insert: Opens the New Graph: Pick a Statistic dialog. Click to add the new graph to the Graphs view.
• Duplicate: Creates a copy of the selected graph and adds it to the list.
• Delete: Deletes the selected graph.
• Import: When you click Import, the program first asks if you would like to delete all graphs before importing? If you choose Yes, all the graphs currently shown in the Graphs view will be deleted and replaced by the contents of the imported *.gph file. If you choose No, the graphs you import will be added to the current list. Use the file Open dialog to navigate to the location of the *.gph file you wish to import, and click OK.
• Export: You can export the entire contents of the Graphs view to a *.gph file, which is a set of parameters for defining all the graphs currently in the Graphs view. This allows you to create and maintain groups of graphs for particular troubleshooting tasks, or for particular environments.
• Bar: Click to change the display to a bar graph.
• Stacked Bar: Click to change the display to a stacked bar graph.
• Skyline: Click to change the display to a skyline graph.
• Stacked Skyline: Click to change the display to a stacked skyline graph.
• Area:Click to change the display to an area graph.
• Stacked Area: Click to change the display to a stacked area graph.
• Line:Click to change the display to a line graph.
• Line/Points:Click to change the display to a line graph with points.
• Points: Click to change the display to a points graph.
• Pie: Click to change the display to a pie graph.
• Donut: Click to change the display to a donut graph.
• Column Percentage: Click to change the display to a column percentage graph.
• Bar Pie: Click to change the display to a bar pie graph.
• Options:Click to open the Graph Display Options dialog, where you can set more configuration options. See Graph display options.
• Pause:Click to temporarily suspend scrolling and view data which has scrolled off-screen to the left. Statistics graphs scroll each time data is refreshed so the most recent data appears at the far right of the screen.
The scroll bar represents the position within a window of the size you set in the Duration parameter. For example, if you set a duration of one hour and have been graphing statistics for only ten minutes, only the right-most portion of the scroll bar will show any graphed data.
TIP: You can restore the default Graphs view by importing the Default Graph.gph file, located in the 1033\Graphs directory.