Forensic search from the Forensics tab
The Forensics tab in the Capture Engines window displays the capture sessions available on the Capture Engine. Performing a forensic search from the Forensics tab lets you select one of the capture sessions, display its data in the Timeline graph, and then perform a forensic search on specific parts of the data.
NOTE: You can also perform a forensic search from the Files tab and from the Forensics Capture window. See Forensic search from the Files tab and Forensic search from the ‘Forensics Capture’ window.
IMPORTANT: One or more capture files saved to the Capture Engine are required before you can perform a forensic search. See Capture Engine capture files and Forensics capture on a Capture Engine.
To perform a forensic search from the Forensics tab:
1. From the Capture Engines window, select the Forensics tab of a connected Capture Engine. The Forensics tab displays the data currently available from the capture storage space of the Capture Engine.
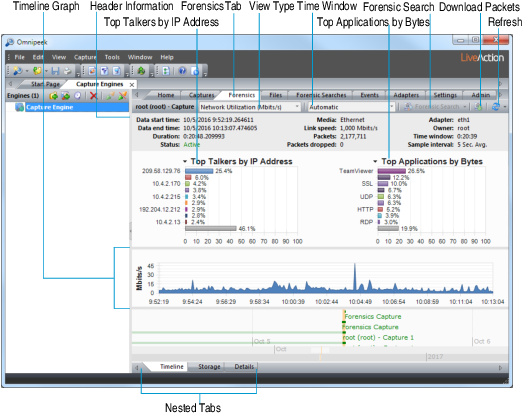
The parts of the Forensics tab are described here:
• Header Information: The header information displays statistics for the capture session (data start time, data end time, duration, status, packets, packets dropped, adapter, etc.).
• Top Talkers by IP Address: This display shows a graph of top “talkers” on the network, broken out by node for the selected area in the Timeline graph below. You can right-click inside the display to display top talkers by Physical Address, IP Address, or IPv6 Address; or to select a Bar or Pie display. Mouse over a bar (or slice) of the graph to view a tooltip with additional details for the node.
• Top Applications: This display shows a graph of top applications on the network for the selected area in the Timeline graph below. You can right-click inside the display to toggle the display with the Top Protocols display, or to select a Bar or Pie display. Mouse over a bar (or slice) of the graph to view a tooltip with additional details for the application.
• Top Protocols: This display shows a graph of top protocols on the network for the selected area in the Timeline graph below. You can right-click inside the display to toggle the display with the Top Applications display, or to select a Bar or Pie display. Mouse over a bar (or slice) of the graph to view a tooltip with additional details for the protocol.
• Timeline graph: The Timeline graph displays the data of the selected capture session. Only one capture session at a time can be displayed inside the graph. By default, the graph shows network utilization in Mbits/s, but other statistics can be graphed as well by selecting the View type.
Here are descriptions of other parts of the Timeline graph:
• Right-click inside the graph to perform a forensic search (see Forensic search below), download selected packets to a capture file, refresh the window, or choose a different graph format: Bar, Stacked Bar, Skyline, Area, Stacked Area, Line, Line/Points, Linear, and Logarithmic. Additionally, you can also toggle displaying the minimum and maximum points for each series on the graph.
• Mouse over a data point in the graph to view a tooltip displaying timestamp and size information (e.g., time and rate, time and packet size, etc.).
• Any time there is more data than can be displayed on the screen, a scroll bar appears below the graph and allows you to view different points of time in the graph. (If the Time window is set to Automatic, the scroll bar will never appear.)
• If the Time window is set to anything other than Automatic, a scroll bar appears below the graph and allows you to view different points of time in the graph.
• View type: Select the type of statistics to display in the Timeline graph. You can select from:
• Network Utilization (Mbits/s)
• Network Utilization (Packets/s)
• Unicast/Multicast/Broadcast
• Packets Sizes
• VLAN/MPLS
• Protocols (Mbits/s)
• Protocols (Packets/s)
• Applications (Mbit/s)
• Applications (Packets/s)
• Call Quality
• Call vs. Network Utilization
• Wireless Packets (Packets/s)
• Wireless Retries (Packets/s)
NOTE: To display statistics for a Call Quality or Call vs. Network Utilization view type, the VoIP Stats option must be selected when you first create the capture and configure the General options of the Capture Options dialog. See Configuring general options.
• Time window: Select the time interval to display in the Timeline graph. By default, Automatic is selected to display the optimum window based on the available data. Intervals from 5 Minutes (1 Sec. Avg.) to 24 Hours (5 Min. Avg.) are also available.
• Forensic search: Click to display the Forensic Search dialog where you can adjust the forensic search settings. Click the small down arrow next to Forensic Search to display custom or pre-configured settings for performing a forensic search. You can change any option prior to clicking :
• Custom: Creates a Forensic Search window based on the customized settings that you configure.
• Overview: Creates a Forensic Search window based on settings that display an overview of the selected data in the capture session.
• Packets: Creates a Forensic Search window containing a packets-only view.
• Expert: Creates a Forensic Search window based on settings that are optimized for Expert analysis.
• Voice & Video: Creates a Forensic Search window based on settings that are optimized for Voice & Video analysis.
• Download Packets: Click to download the packets from the selected capture session, in the selected time range.
• Refresh: Click to refresh the screen. For an active capture session, you can also set an automatic refresh interval by selecting an interval from the drop-down list to the right of .
• Nested tabs: There are three nested tabs available from within the Forensics tab: Timeline, Storage, and Details. Each tab allows you to view and select the capture data you wish to search in various formats. The Timeline, Storage, and Details tabs are described in detail below.
2. From any of the nested tabs, click (double-click from the Details tab) the capture session you wish to search. The selected capture session is displayed in orange to indicate it is selected, and the data for the capture session is loaded into the Timeline graph at the top.
IMPORTANT: A session represents a contiguous period of time when packets are captured from a particular interface. A session is created each time you start a capture. A capture can have multiple sessions, and each session can be separated by periods of inactivity (from stopping and starting the capture). Forensic analysis can then be performed on each session. Sessions are displayed in the nested tabs available from the Forensics tab.
3. In the Timeline graph, drag to select the area of the selected capture you wish to search. If no area of the graph is selected, the entire capture is selected by default.
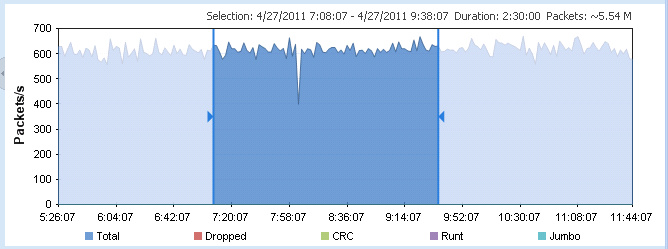
NOTE: The packet count displayed above the Timeline graph is an approximation of the packets currently selected.
TIP: You can adjust the exact time range from the Forensic Search dialog.
4. Click (or click the small down arrow next to and select the type of forensic search you wish to perform). The Forensic Search dialog appears.
NOTE: Selecting one of the pre-defined types of forensic searches displays the Forensic Search dialog with the Analysis & Output options pre-configured for that type of forensic search. You can change any option prior to clicking .
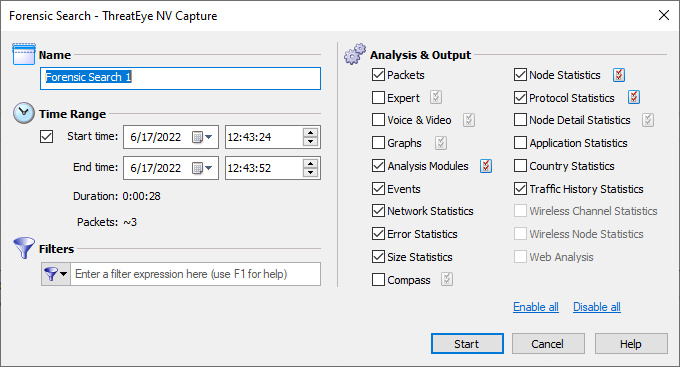
5. Complete the dialog to specify the criteria for extracting data from the selected capture:
• Name: Enter a name for the forensic search.
• Time Range: Select this option and then configure the start and end times to extract the data.
• Start time: Set the start date and time for extracting data.
• End time: Set the end date and time for extracting data.
• Duration: Displays the amount of time between the specified start and end times.
• Filters: Click to select a filter from the display list. All packets will be accepted if no filters are applied to the forensic search.
To create an advanced filter, click Filters and select filters, operators, or expressions from the display. For detailed instructions, please see Creating filters using the filter bar.
• Analysis & Output: Select one or more of the options to enable and display that particular view in the new Forensic Search window. For various Analysis & Output options that have additional configurable settings, click the submenu to the right of the option.
6. Click . A new Forensic Search window appears along with two progress bars at the top of the window. (Clicking stops the search and then completes the processing of the packets.)
Once the processing of the packets is complete, the progress bars go away and the new Forensic Search window is populated with the data found based on the criteria you selected above.
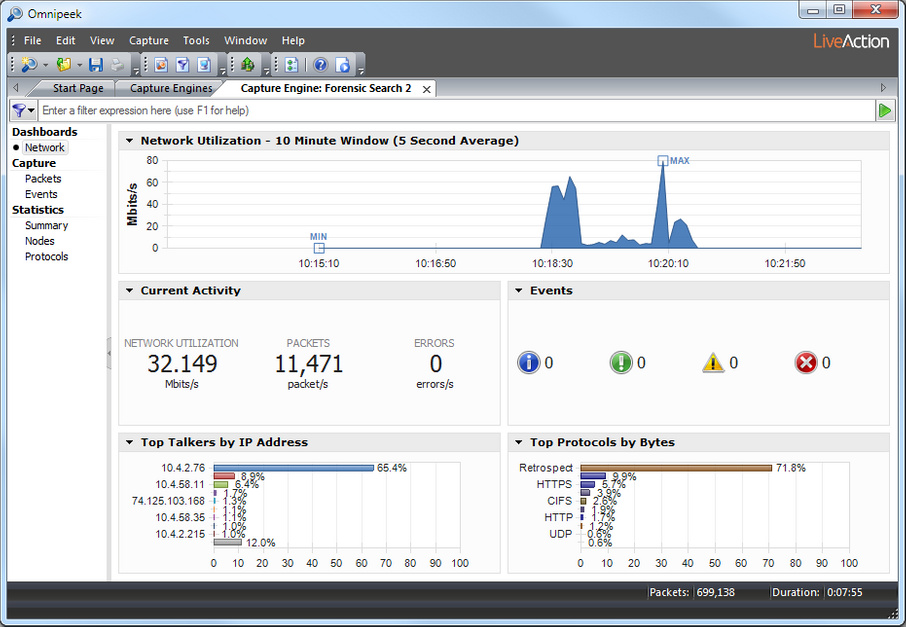
7. From the new Forensic Search window, you can further narrow down the data by performing any of the post-capture analysis methods described earlier.
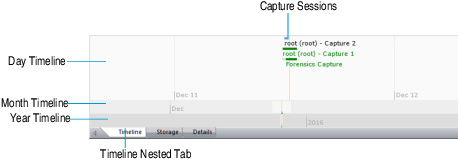
Timeline nested tab
The Timeline nested tab has three bands of timelines (Day, Month, Year) that are used to display the capture sessions available from the storage space on the Capture Engine. You can select a capture session from the day band to display the session in the Timeline graph above.
Here are some useful notes for using the Timeline nested tab:
• Capture sessions are represented with a horizontal green or blue bar and the name of the main parent capture. Simply click a capture session to view its data within the Timeline graph above.
• Only one capture session at a time can be selected and displayed in the Timeline graph.
• A capture session that is highlighted with an orange vertical bar indicates it is currently selected. A capture session that has green colored text indicates it is currently active and is capturing packets.
• Capture sessions may be overwritten by another session in the same capture if the capture was created as a ‘continuous capture,’ and the session ‘wraps’ after exceeding the disk space allocated for the capture. See Configuring general options.
If a capture session ‘wraps,’ the horizontal green or blue bar appears with a lighter color to indicate that capture sessions were overwritten. Any data that is overwritten is no longer available for analysis.
• Drag inside a timeline band to view different points of time within the timeline band. The other timeline bands will move accordingly.
• Right-click inside a timeline band to quickly move to various points within the timeline. You can select from:
• Go to Current: Moves all three timeline bands so that the currently selected capture session is centered inside the display.
• Go to Now: Moves all three timeline bands so that the current time is centered inside the display.
• Go to Earliest: Moves all three timeline bands so that the earliest available capture session is centered inside the display.
• Go to Latest: Moves all three timeline bands so that the latest available capture session is centered inside the display.
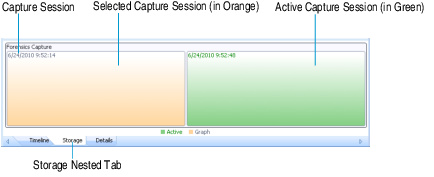
Storage nested tab
The Storage nested tab displays each capture session from the storage space on the Capture Engine as a container nested within a larger parent container.
Here are some useful notes for using the Storage nested tab:
• A capture session that is colored orange indicates it is currently selected. A capture session that is colored green indicates it is currently active and is capturing packets.
• Capture sessions may be overwritten by another session in the same capture, if the capture was created as a ‘continuous capture’ and the session ‘wraps’ after exceeding the disk space allocated for the capture. See Configuring general options. When data from a capture session is overwritten with new data, the old data is no longer available for analysis.
• Only one capture session at a time can be selected and displayed in the Timeline graph.
• Mouse-over a capture session container to view a tooltip displaying details about the capture session.
• Right-click a capture session to display the following options:
• View: Loads the selected capture session into the Timeline graph above.
• Delete: Removes the selected capture and all of its capture sessions, packet data, and statistics from the capture storage space on the Capture Engine. You will be prompted to verify any deletions. Only a parent capture, and not individual capture sessions, can be deleted from the list.
• Delete All: Removes all captures, capture sessions, packet data, and statistics from the capture storage space on the Capture Engine. You will be prompted to verify any deletions.
• Show Unreserved Space: Displays the amount of space that is not currently being used as capture storage space on the Capture Engine.
• Show Legend: Displays a color-coded legend for the capture sessions.
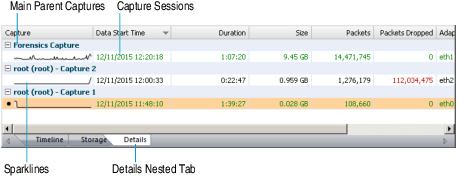
Details nested tab
The Details nested tab displays capture sessions available from the storage space on the Capture Engine as a list in tabular format. Each capture session is displayed under its main parent capture. The main parent capture is a collapsible list that can be expanded or collapsed to show and hide its capture sessions.
Here are some useful notes for using the Details nested tab:
• The small graph below the name of a capture is a sparkline—a small version of the Timeline graph for each capture session which makes it easier to see the status of multiple capture sessions at a glance.
• A capture session that is colored orange indicates it is currently selected. A capture session that is colored green indicates it is currently active and is capturing packets.
• Capture sessions may be overwritten by another session in the same capture, if the capture was created as a ‘continuous capture’ and the session ‘wraps’ after exceeding the disk space allocated for the capture. See Configuring general options. An overwritten capture session is no longer available for analysis.
• Only one capture session at a time can be selected and displayed in the Timeline graph.
• Right-click a column heading to display or hide a specific column. Click a column heading to sort its data. See Capture Engine details tab columns for a description of the available columns.
• Right-click a capture session or parent capture to display the following options:
• View: Loads the selected capture session into the Timeline graph above. Only a capture session, and not a parent capture, can be loaded into the Timeline graph.
• Delete: Removes the selected capture and all of its capture sessions, packet data, and statistics from the capture storage space on the Capture Engine. You will be prompted to verify any deletions. Only a parent capture, and not individual capture sessions, can be deleted from the list.
• Delete All: Removes all captures, capture sessions, packet data, and statistics from the capture storage space on the Capture Engine. You will be prompted to verify any deletions.
• Expand All: Expands the list so that all capture sessions are displayed below the parent capture.
• Collapse All: Collapses the list so that all capture sessions are hidden below the parent capture.