Timing column
The Timing column shows abbreviated versions of the full packet timing graph displayed in the Timing tab (see Timing tab). These packet timing graphs show the duration, packets, and phases of each HTTP request.
To view the Timing column, right-click in the column header and select .
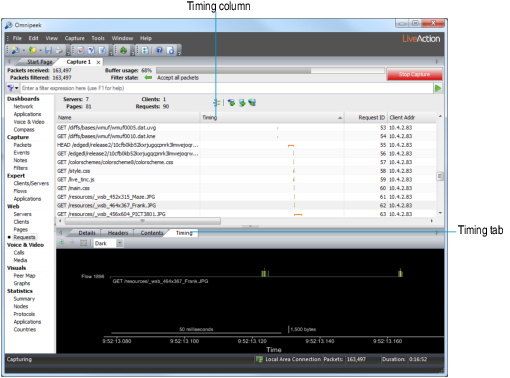
The following key describes the colors and phases of the packet timing graph:
• Orange line: This represents the idle phase, either after SYN sets up the connection but before first data packet, or after the last data packet but before FIN packets shut down the connection. Often there is little or no idle phase before the first data packet, but a long idle phase after the last packet. This occurs because most clients will keep a connection open in case they need to fetch more data from the server.
• Blue line (default client color): This shows the request phase, when the client is sending its HTTP GET and waiting for a response. You can reset the client and server colors in the Client/Server view of the Options dialog. See Setting client/server colors.
• Green line (default server color): This shows the response phase, when the server is sending its data back to the client. You can reset the client and server colors in the Client/Server view of the Options dialog. See Setting client/server colors.
• Purple line: This shows a reset connection, which is the idle period after the last data packet and the TCP RST packet.
• Tick marks: Individual server packets appear as tick marks above the packet timing graph. Individual client packets appear as tick marks below the packet timing graph. Tick mark height corresponds to TCP payload length.
The following provides examples of how to read phases of the packet timing graph:
Example |
|---|

From left to right, an initial orange SYN packet from the client appears below the packet timing graph, which is almost immediately answered with an orange SYN packet from the server above the packet timing graph. There is an idle period where the packet timing graph remains in its orange SYN phase, and then a single blue client request packet appears. The server responds almost immediately with a block of tall green packets. Note: This request lacks a final orange FIN phase, so it is likely that this flow was reused for subsequent HTTP requests. The FIN phase appears after the last HTTP request on this same flow. |

From left to right, a tiny orange SYN packet appears above the packet timing graph, from the server. This is directly above a tiny blue request packet below the packet timing graph, from the client. An orange SYN packet appears below the packet timing graph, from the client. There is a blue phase where the client waits for a response, eventually followed by green tick marks showing response packets from the server. The server then pauses a moment before sending the final packet and finishing the request. |

In this example, a single blue packet appears below the packet timing graph, followed by a long purple idle period, and eventually a purple TCP RST packet from the client. This shows that the client requested some data, never heard back from the server, and eventually closed the connection with a TCP reset. |