Forensic search from the ‘Forensics Capture’ window
If you created a ‘Forensics Capture’ window, you can perform a forensic search directly from the capture window. A forensic search creates a new Forensic Search window.
NOTE: You can also perform a forensic search from the Files or Forensics tab. See Forensic search from the Files tab and Forensic search from the Forensics tab.
To perform a forensic search from the ‘Forensics Capture’ window:
1. Create a ‘Forensics Capture’ window as described in Creating a Capture Engine capture.
2. Click the Timeline dashboard to display the new ‘Forensics Capture’ window.
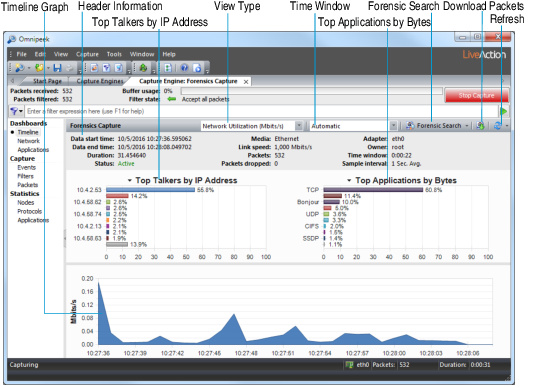
The parts of the Timeline dashboard are described here:
• Header Information: The header information displays statistics for the capture session (data start time, data end time, duration, status, packets, packets dropped, adapter, etc.).
• Top Talkers by IP Address: This display shows a graph of top “talkers” on the network, broken out by node for the selected area in the Timeline graph below. You can right-click inside the display to select a Bar or Pie display. Mouse over a bar (or slice) of the graph to view a tooltip with additional details for the node.
• Top Applications by Bytes: This display shows a graph of top applications on the network for the selected area in the Timeline graph below. You can right-click inside the display to toggle the display with the Top Protocols display, or to select a Bar or Pie display. Mouse over a bar (or slice) of the graph to view a tooltip with additional details for the application.
• Top Protocols by Bytes: This display shows a graph of top protocols on the network for the selected area in the Timeline graph below. You can right-click inside the display to toggle the display with the Top Applications display, or select a Bar or Pie display. Mouse over a bar (or slice) of the graph to view a tooltip with additional details for the protocol.
• Timeline graph: The Timeline graph displays the data of the capture window. By default, the graph shows utilization in Mbits/s, but other statistics can be graphed as well by selecting the View type.
Here are descriptions of other parts of the Timeline graph:
• Right-click inside the graph to perform a forensic search (see Forensic search below), download selected packets to a capture file, refresh the window, or choose a different graph format: Bar, Stacked Bar, Skyline, Area, Stacked Area, Line, Line/Points, Linear, and Logarithmic. Additionally, you can also toggle displaying the minimum and maximum points for each series on the graph.
• Mouse over a data point in the graph to view a tooltip displaying timestamp and size information (e.g., time and rate, time and packet size, etc.).
• Any time there is more data than can be displayed on the screen, a scroll bar appears below the graph and allows you to view different points of time in the graph. (If the Time window is set to Automatic, the scroll bar will never appear.)
• If the Time window is set to anything other than Automatic, a scroll bar appears below the graph and allows you to view different points of time in the graph.
• View type: Select the type of statistics to display in the Timeline graph. You can select from:
• Network Utilization (Mbits/s)
• Network Utilization (Packets/s)
• Unicast/Multicast/Broadcast
• Packets sizes
• VLAN/MPLS
• Protocols (Mbits/s)
• Protocols (Packets/s)
• Call Quality
• Call vs. Network Utilization
• Wireless Packets (Packets/s)
• Wireless Retries (Packets/s)
NOTE: To display statistics for a Call Quality and Call vs. Network Utilization view type, the VoIP Stats option must be selected when the capture was created and configured in the General options of the Capture Options dialog.
• Time window: Select the time interval to display in the Timeline graph. By default, Automatic is selected to display the optimum window based on the available data. Intervals from 5 Minutes (1 Sec. Avg.) to 24 Hours (5 Min. Avg.) are also available.
• Forensic search: Click to display the Forensic Search dialog where you can adjust the forensic search settings. Click the small down arrow next to Forensic Search to display custom or pre-configured settings for performing a forensic search. You can change any option prior to clicking :
• Custom: Creates a Forensic Search window based on the customized settings that you configure.
• Overview: Creates a Forensic Search window based on settings that display an overview of the selected data in the capture session.
• Packets: Creates a Forensic Search window containing a packets-only view.
• Expert: Creates a Forensic Search window based on settings that are optimized for Expert analysis.
• Voice & Video: Creates a Forensic Search window based on settings that are optimized for Voice & Video analysis.
• Download Packets: Click to download the packets from the selected time range.
• Refresh: Click to refresh the screen. For an active capture session, you can also set an automatic refresh interval by selecting an interval from the drop-down list to the right of .
3. In the Timeline graph, drag to select the area of the capture you wish to search. If no area of the graph is selected, the entire capture is selected by default.
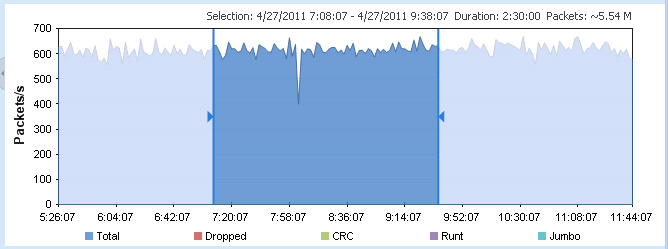
NOTE: The packet count displayed above the Timeline graph is an approximation of the packets currently selected.
TIP: You can adjust the exact time range from the Forensic Search dialog.
4. Click (or click the small down arrow next to Forensic Search and select the type of forensic search you wish to perform). The Forensic Search dialog appears.
NOTE: Selecting one of the pre-defined types of forensic searches displays the Forensic Search dialog with the Analysis & Output options pre-configured for that type of forensic search. You can change any option prior to clicking .
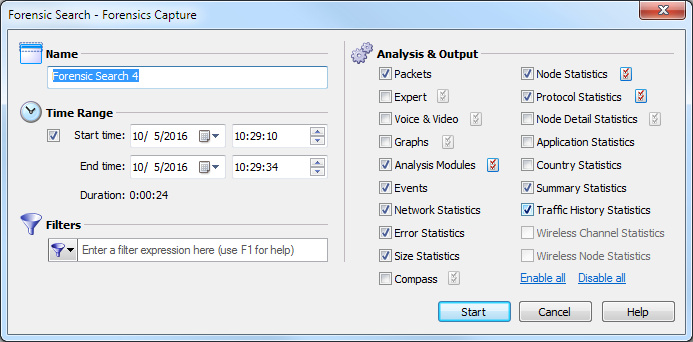
5. Complete the dialog to specify the criteria for extracting data from the selected capture:
• Name: Enter a name for the forensic search.
• Time Range: Select this option and then configure the start and end times to extract the data.
• Start time: Set the start date and time for extracting data. Only the data captured between the start time and end time is extracted.
• End time: Set the end date and time for extracting data. Only the data captured between the start time and end time is extracted.
• Duration: Displays the amount of time between the specified start and end times.
• Filters: Click to select a filter from the display list. All packets will be accepted if no filters are applied to the forensic search.
To create an advanced filter, click Filters and select Insert filter, Insert Operator, or Insert Expression from the display.
• Analysis & Output: Select one or more of the options to enable and display that particular view in the new Forensic Search window. For various Analysis & Output options that have additional configurable settings, click the submenu to the right of the option.
6. Click . A new Forensic Search window appears along with two progress bars at the top of the window. (Clicking stops the search and then completes the processing of the packets.)
Once the processing of the packets is complete, the progress bars go away and the new Forensic Search window is populated with the data found based on the criteria you selected above. The name of the Forensic Search window is added to the list of currently active forensic searches in the Forensic Searches tab.
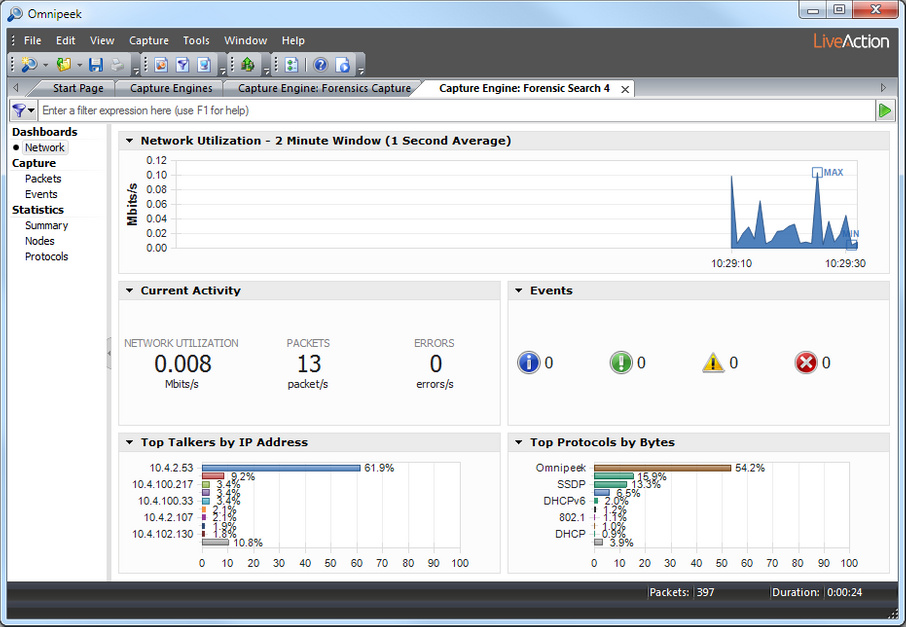
7. From the new Forensic Search window, you can further narrow down the data by performing any of the post-capture analysis methods described in the Omnipeek User Guide.