Expert EventFinder
The EventFinder scans traffic in a capture window, looking for network anomalies and sub-optimal performance at all layers of the network, from application to physical. It also shows network events associated with VoIP calls. For a complete list of expert events, see Expert Events.
To open the Expert EventFinder Settings window, choose one of the following:
• Click Expert EventFinder Settings in the toolbar of the Expert view.
• Right-click and choose EventFinder Settings.
The parts of the Expert EventFinder Settings window are identified below. The window is context-sensitive and displays only parts relevant to the selected event.
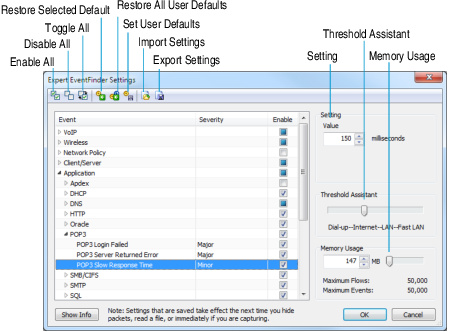
• Enable All: Select all of the events to be scanned in a capture window.
• Disable All: Deselect all of the events (none will be scanned).
• Toggle All: Reverse state of events between Enable All and Disable All.
• Restore Selected Defaults: Highlight an event or events and click to restore default values.
• Restore All User Defaults: Restore default values to all events.
• Set User Defaults: Establish the current settings as the new (user-defined) default EventFinder settings on the Omnipeek console or the Capture Engine.
• Import Settings: Restores a previously saved group of settings. Click and navigate to the location of an *.xml settings file.
• Export Settings: Saves the current EventFinder settings as an *.xml file.
NOTE: When you or on a Capture Engine, the Open and Save As dialogs will refer to the Omnipeek console computer.
• Event: This column shows the events arranged under their network layers.
• Severity: This column shows the level of severity of notification the Expert will send when it encounters a matching event. Click the entry in the Severity column to set the level of severity of these notifications. See Sending Notifications.
• Enable: This column allows you to enable or disable individual events or network layers by selecting the check box(es) for that layer. When only some events within a layer are enabled, a square appears in the check box for that layer.
• Setting: Set the Value and units that mark the threshold of the condition for the selected event. For example, if the Setting Value for POP3 Slow Response Time is 150 milliseconds, then when this event is enabled, it will report any response time greater than 150 milliseconds as an event. Note that not all events require a setting value. Some, such as DHCP Request Rejected, simply check for a particular occurrence or packet type.
• Threshold Assistant: This setting helps you choose settings that can be expected to vary with network bandwidth. For example, with POP3 Slow Response Time as the selected event, moving the slider bar to the left will increase the setting value, allowing for the slower POP3 response times that you would expect over a Dial-up connection. If you move the slider bar to the right, the Value decreases, reflecting the faster POP3 response times you would expect over a LAN or Fast LAN, appropriate for POP3 connections over the Internet.
• Memory Usage: Set the maximum memory by entering the value directly in the edit box in MB (megabytes), or by using the slider bar to the right of the edit box. See Expert memory usage.
• Show Info: Click to see a more complete description of the event, including possible causes and remedies.
TIP: Click to display the Description, Possible Causes, and Possible Remedies for a selected event.